Products You May Like
Recently, the TaxA tax is a mandatory payment or charge collected by local, state, and national governments from individuals or businesses to cover the costs of general government services, goods, and activities.
Foundation’s educational program, TaxEDU, conducted a national tax poll to understand American taxpayers’ knowledge of and opinions about the tax code. The results: most Americans are confused by and dissatisfied with the federal tax code.
To make sound financial decisions and support better tax policy, taxpayers should understand the taxes they face. Unfortunately, most U.S. taxpayers do not know or are unsure of basic tax concepts.
We reported results that showed more than two-thirds of respondents did not know the top federal income tax rate and over half did not know how tax brackets work. The majority of respondents also answered incorrectly when surveyed about the value of tax credits versus tax deductions.
TaxEDU’s purpose is to advance tax policy education, discussion, and understanding in classrooms, living rooms, and government chambers. So, what are the correct answers to the tax literacy portion of the poll?
Question 1: To the best of your knowledge, what tax rate applies to the top U.S. federal income tax bracketA tax bracket is the range of incomes taxed at given rates, which typically differ depending on filing status. In a progressive individual or corporate income tax system, rates rise as income increases. There are seven federal individual income tax brackets; the federal corporate income tax system is flat.
?
The top federal income tax bracket for the 2023 tax filing season was 37 percent. This bracket applies to income of $578,125 or more for single filers, or $693,750 and above for married individuals filing joint tax returns. For heads of household, the rate is applied to income of $578,100 or more.
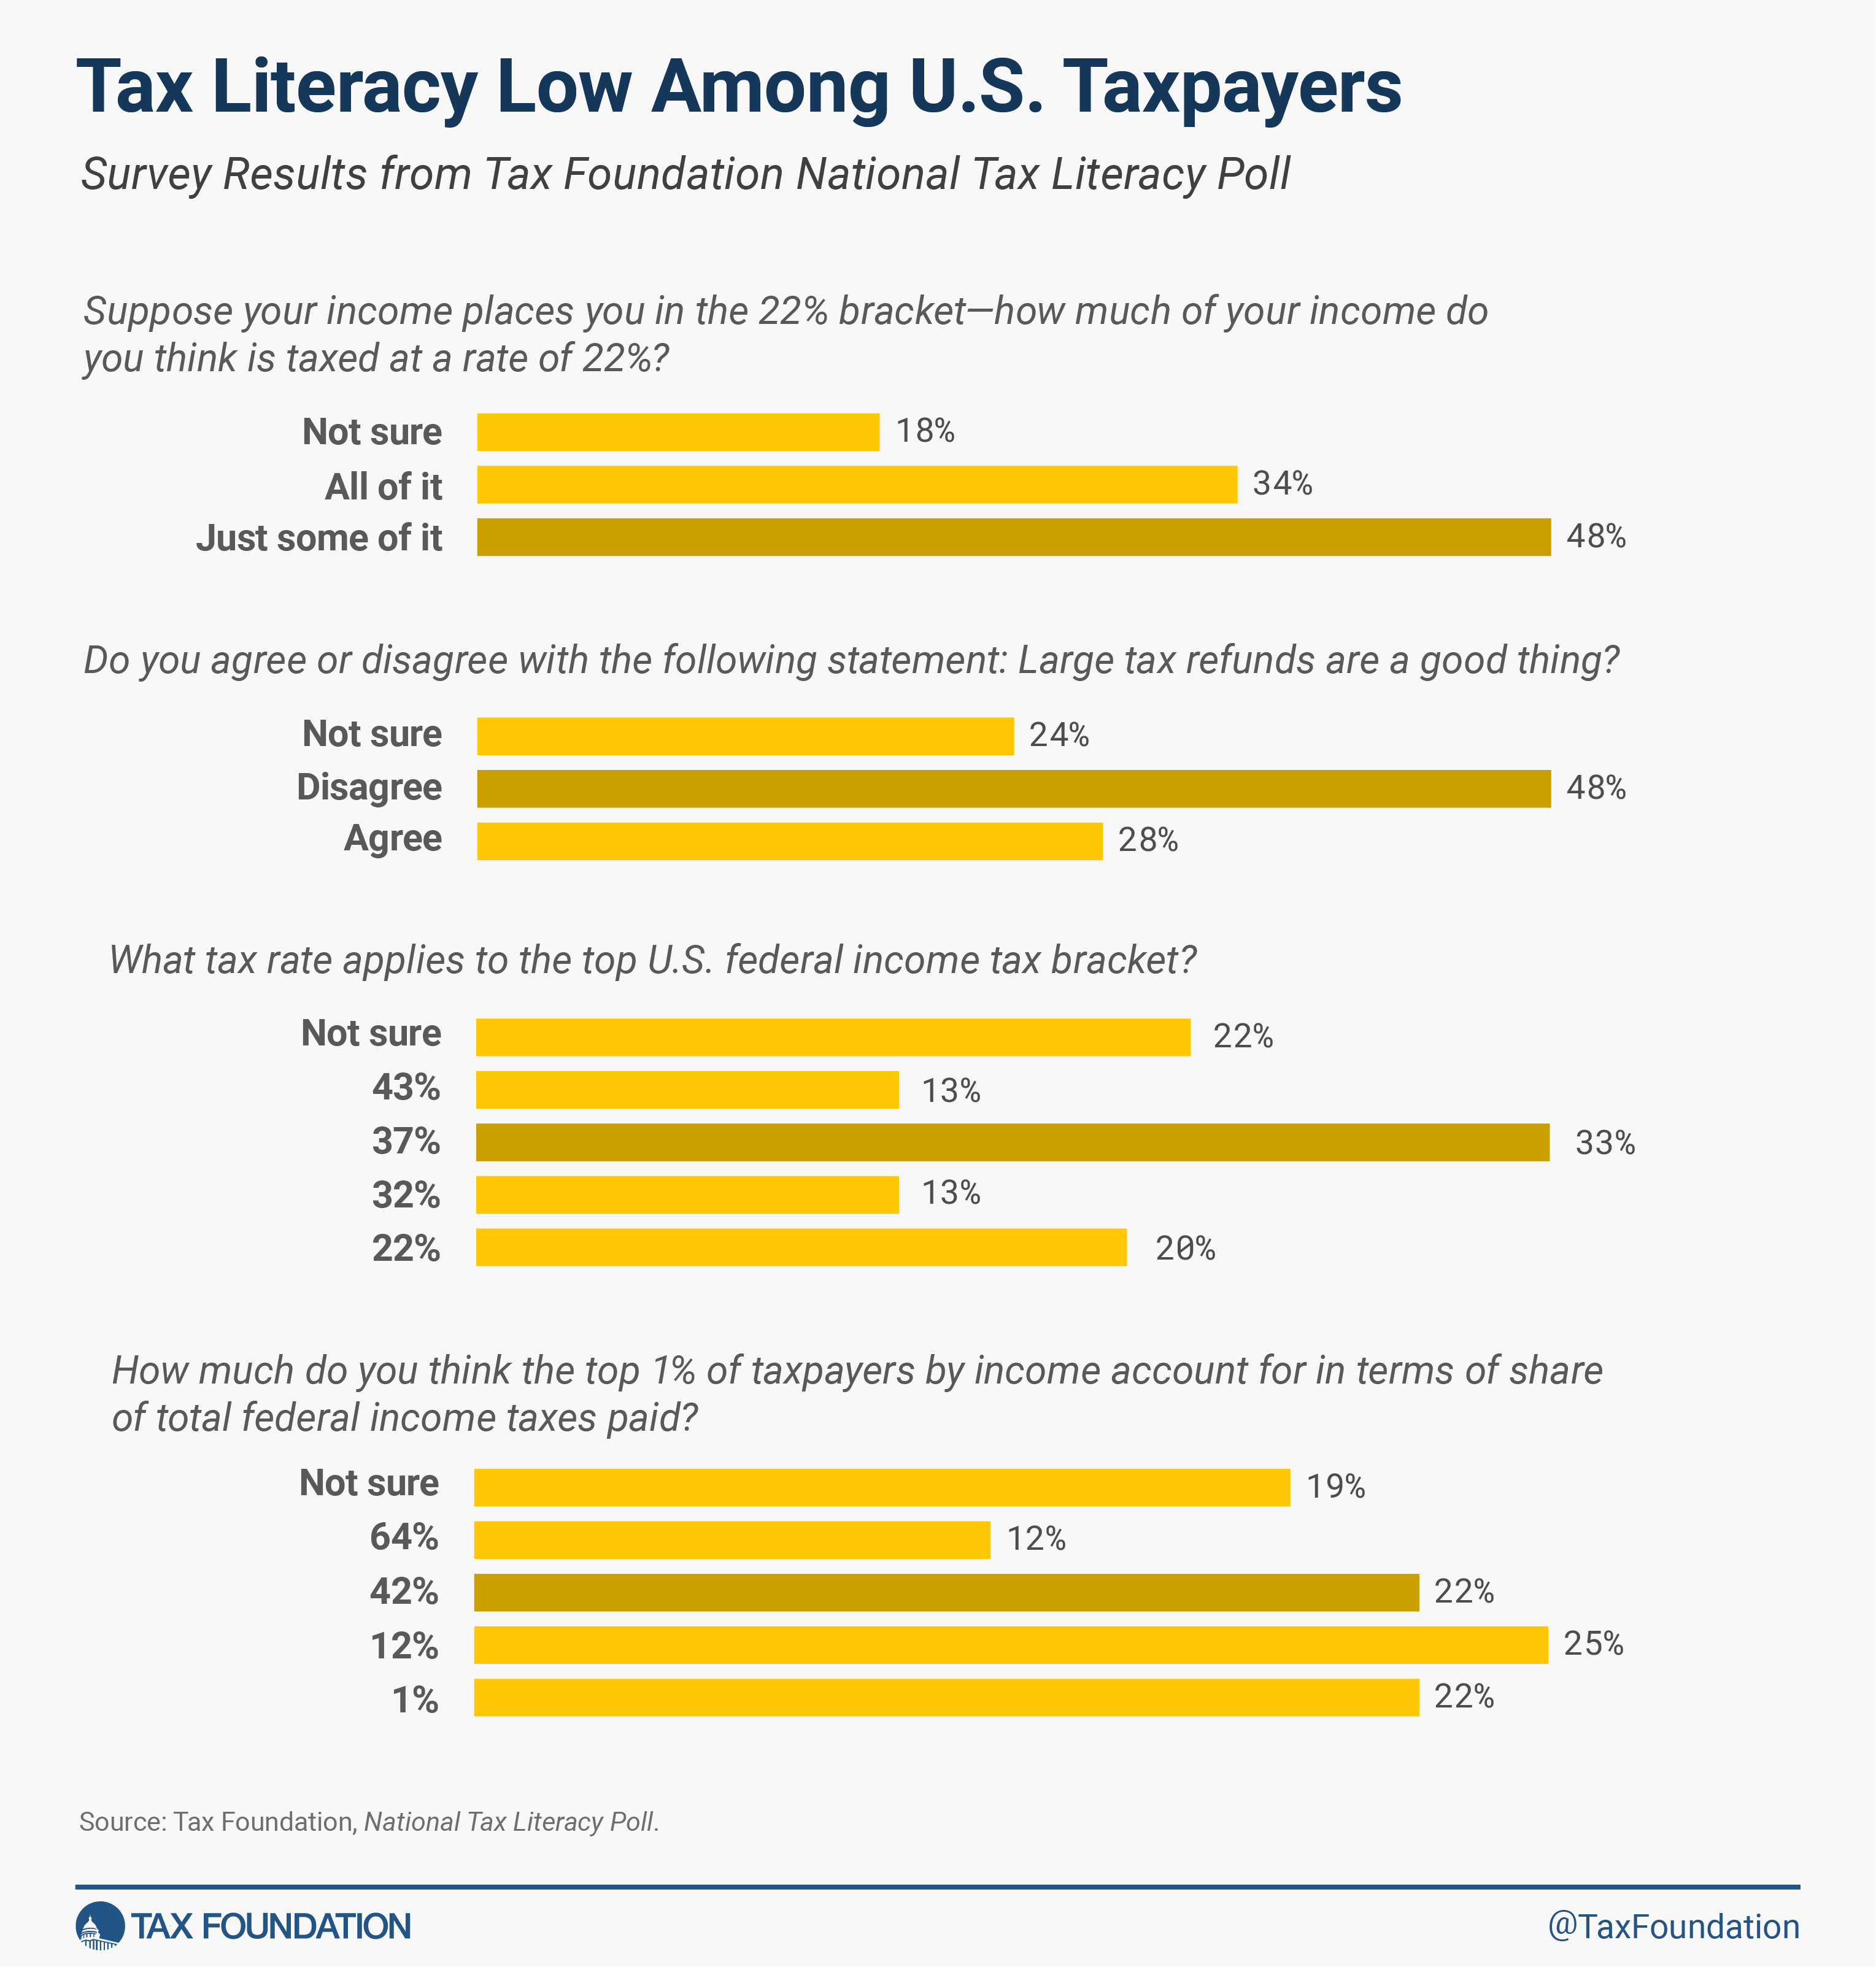
Of those surveyed, only 33 percent answered this question correctly.
Respondents who fall into lower tax brackets answered this question with less accuracy (18 percent correct) than those in higher brackets (44 percent correct). But understanding this question is important for all taxpayers.
Understanding the distribution of the tax burden can influence your personal financial decision-making, how you interact with conversations about taxing high earners, and even how you vote.
When we dove deeper into tax brackets themselves, over half did not know or were unsure of how tax brackets work.
Question 2: Suppose your income places you in the 22% bracket—how much of your income do you think is taxed at a rate of 22%: just some of it, or all of it?
The U.S. federal income tax is a progressive, graduated rate system, where rates increase as earnings increase. This system currently features seven tax brackets—or ranges of income—that are taxed at rates from 10 percent to 37 percent.
The tax rate associated with your top tax bracket does not apply to all your income, just the portion that falls into that highest bracket.
How does this work? Any income that falls within the range of the first/lowest bracket is taxed only at that rate (10 percent in 2023). The very next dollar you earn over that first bracket then falls into the second bracket and only those additional dollars within the range of that bracket face that rate (12 percent in 2023).
This continues until you reach your top bracket.
It is important for all taxpayers to understand how tax brackets work to not only understand their own tax burden, but also to inform decisions about performing extra work through a second job or overtime, or pursuing new streams of income.
Question 3: Suppose you are being taxed at a rate of 10% on $10,000 of income, which do you think is more valuable to you: a $1,000 income tax deductionA tax deduction is a provision that reduces taxable income. A standard deduction is a single deduction at a fixed amount. Itemized deductions are popular among higher-income taxpayers who often have significant deductible expenses, such as state and local taxes paid, mortgage interest, and charitable contributions.
or a $1,000 income tax creditA tax credit is a provision that reduces a taxpayer’s final tax bill, dollar-for-dollar. A tax credit differs from deductions and exemptions, which reduce taxable income, rather than the taxpayer’s tax bill directly.
or do you think those are the same thing?
When asked which was more valuable: a $1,000 tax credit or a $1,000 tax deduction, 64 percent of respondents answered incorrectly or were unsure which provided more value when filing. The answer to the question above? The $1,000 credit is more valuable.
Tax credits directly reduce tax liability dollar for dollar, while tax deductions reduce tax liability by the amount deducted multiplied by the taxpayer’s marginal tax rateThe marginal tax rate is the amount of additional tax paid for every additional dollar earned as income. The average tax rate is the total tax paid divided by total income earned. A 10 percent marginal tax rate means that 10 cents of every next dollar earned would be taken as tax.
.
A $1,000 income tax credit would save you $1,000 outright, while a $1,000 deduction would only reduce your taxable incomeTaxable income is the amount of income subject to tax, after deductions and exemptions. For both individuals and corporations, taxable income differs from—and is less than—gross income.
by $1,000, saving you $100.
For those in the lower income quintiles, tax credits are generally more valuable than deductions, since there is less income to deduct and marginal tax rates are lower. By contrast, deductions may be preferred by some higher-income taxpayers since they are subject to higher marginal tax rates.
Question 4: How much do you think the top 1% of taxpayers by income account for in terms of share of total federal income taxes paid?
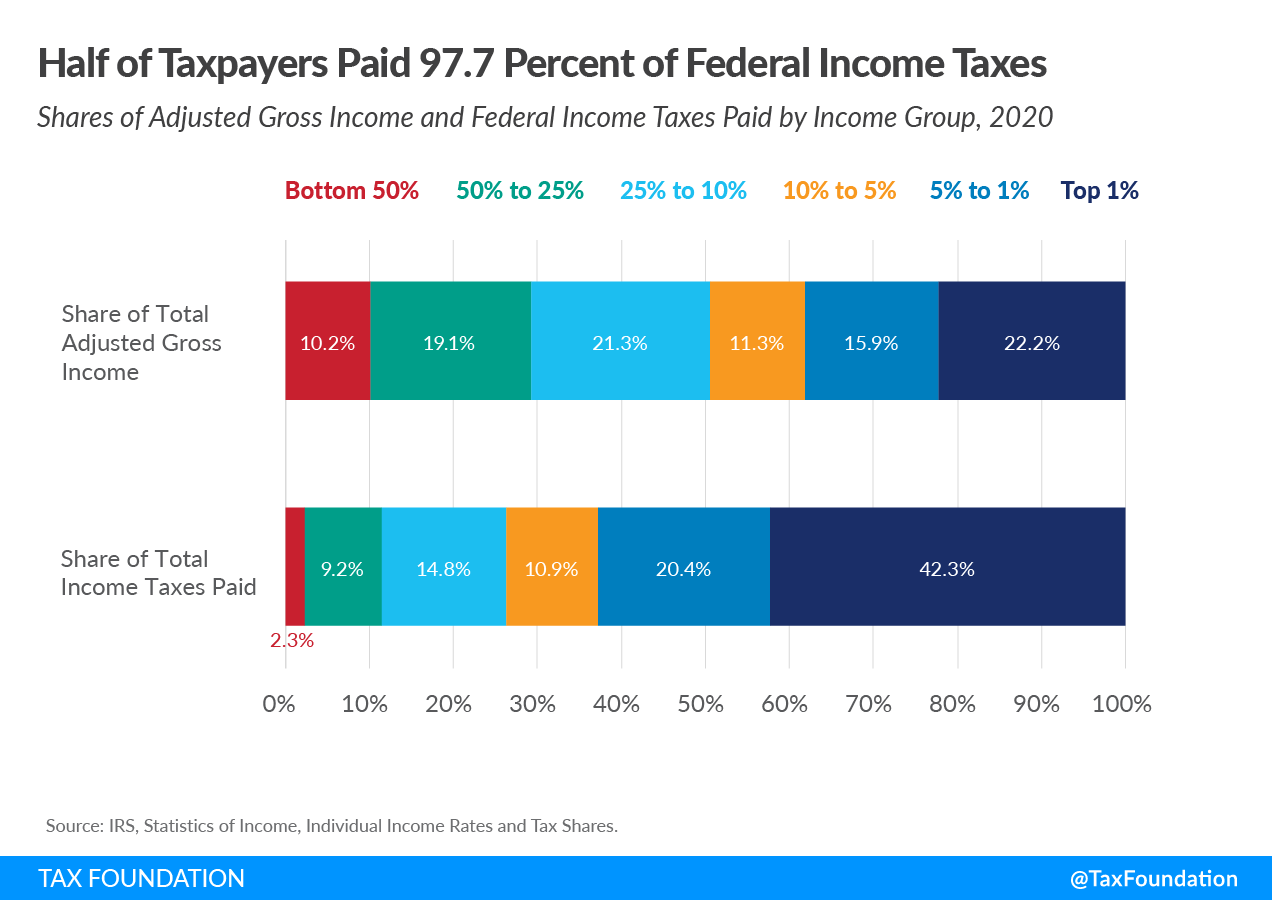
78 percent did not know or were unsure of the share the top 1 percent of earners pay in federal income taxes: approximately 42 percent.
The share of income taxes paid by the top 1 percent increased from 33.2 percent in 2001 to 42.3 percent in 2020. Over the same period, the share paid by the bottom 50 percent of taxpayers fell from 4.9 percent to just over 2.3 percent in 2020.
A popular discourse when it comes to U.S. tax policy is that high earners should be taxed more. By understanding what share high earners currently pay, we can have more robust discussions surrounding tax policy, and support more sound policy suggestions from elected officials.
Question 5: Do you agree or disagree with the following statement: Large tax refunds are a good thing.
Of those surveyed, 48 percent understood tax refunds were nothing to celebrate.
Many of us look forward to receiving a refund when it comes time to file our taxes. Extra money is exciting to receive, but only if it’s genuinely “extra money.”
A tax refundA tax refund is a reimbursement to taxpayers who have overpaid their taxes, often due to having employers withhold too much from paychecks. The U.S. Treasury estimates that nearly three-fourths of taxpayers are over-withheld, resulting in a tax refund for millions. Overpaying taxes can be viewed as an interest-free loan to the government. On the other hand, approximately one-fifth of taxpayers underwithhold; this can occur if a person works multiple jobs and does not appropriately adjust their W-4 to account for additional income, or if spousal income is not appropriately accounted for on W-4s.
is nothing to celebrate because it is not “extra money.” If you receive a refund, it’s because you over-withheld and gave the government an interest-free loan for the year. If your withholdingWithholding is the income an employer takes out of an employee’s paycheck and remits to the federal, state, and/or local government. It is calculated based on the amount of income earned, the taxpayer’s filing status, the number of allowances claimed, and any additional amount of the employee requests.
was accurate and you had that money instead, you could have made money with it by, say, putting it in a savings account or investing in the stock market.
National Tax Literacy Poll
Our national tax poll surveyed more than 2,700 U.S. taxpayers over 18 years old—spanning the political spectrum and income distribution.
This survey reveals how, despite taxes playing a significant role in personal finances and being levied on a sizable portion of the U.S. population, most Americans are not just unhappy with the current tax code but also do not understand it. Education is the first step in achieving more accurate and productive conversations about taxes, more informed financial decision-making, and even better tax policies.
Note: This is the second in a series of blog posts about the Tax Foundation’s National Tax Literacy Poll. A full analysis will be released at the end of the series. The survey data is available upon request at this time and will be accessible via our website with the release of the full analysis.
Stay updated on the latest educational resources.
Level-up your tax knowledge with free educational resources—primers, glossary terms, videos, and more—delivered monthly.
Share

